
Have you ever thought to yourself, “it seems like those guys always lose when they wear that jersey”? Well, it turns out there may be some underlying truth to your sartorial assumption.
Over the past three-and-a-half months we here at SportsLogos.Net have been tracking each and every cap, jersey, and pants combo worn by every team in every game of the 2013 Major League Baseball season. We’ve cross-referenced that data with wins and losses, resulting in what I’m pretty sure is the first ever batch of MLB wins-per-uniform stats ever.
In case you were unaware, all of this information is available for your viewing pleasure over in our MLB Uniform Matchup Tracker, or whatever we end up calling it… we’re still working on a name. Using our uniform matchup tracker you can see who wore what – and how they performed in those digs — for any day of the 2013 baseball season. It will continue to be updated daily throughout the second half of the season.

You can check out the time in April when the Mets wore their 1993 home uniforms for a game in Denver; or track Milwaukee’s uniform selection game-to-game from the ten different ones they’ve worn this year; or see the whole collection of camo caps and uniform matchups worn on Memorial Day; or just try not to strain your eyes looking at every Oakland A’s yellow jersey game at the same time. It’s all there, feel free to browse around and enjoy yourself!
With all the game results printed out and scattered across the burnished mahogany table that stretches from one end to the other of the executive board room at Galactic Sports Logos Command Center, we noticed several oddities. After reprinting the pages JR spilled bourbon on, we have found some amazing anomalies which we feel would have otherwise never been noticed by the fans, media, or even the team itself. We’ve assembled just a few of these interesting jersey stats in the paragraphs below, if you want to see the jersey and cap data for any team, including your favourite, the links to every team are at the bottom of this article.
ATLANTA BRAVES “CREAM” ALTERNATES

The Atlanta Braves enjoyed a positively torrid start to April, going 13-2 to open the season. Their pace has normalized a bit, but they are still playing better than their division, even if you ignore the first 15 games of the season. (But why would you, they count.)
Now they enter the break at 54-41, 29 of which were come-from-behind wins. Good for a 6 game lead in the NL East, the biggest lead in any division by a considerable amount. Boston and Arizona each lead their divisions by two and a half games, tying one another for the second biggest division lead.
So, what could possibly make this team any better? Follow the Wu-Tang, and remember “CREAM.”
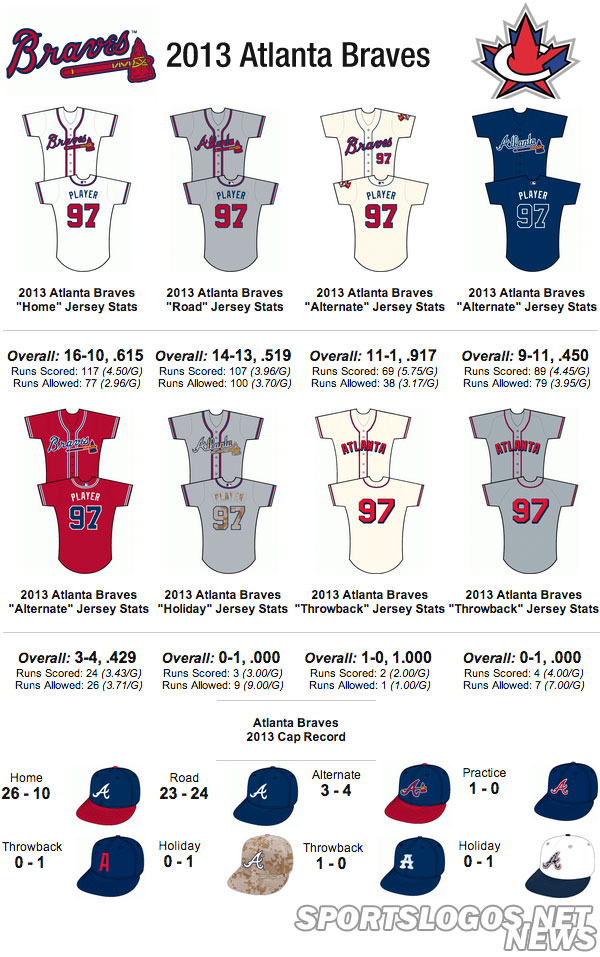
Not about cash, but the colour. When wearing their cream alternate “sorta” throwbacks, they are an absolutely blistering 11-1. It wasn’t until the last game before the break that the Braves lost their first game in the cream uniforms, and that was a game where their line-up looked like a spring training split-squad game. It took injuries to 4 starters to stop the power of the cream retro jersey. The stats are there: They go off on offense when they wear them, scoring 5.75 runs per game (up from a season average of 4.3.) It also looks like a great idea for them to wear their normal primary cap, as they are 26-10 in that version. 28- 31 in all the other caps combined.
Since the Braves have said that their starting pitcher chooses the uniform and cap combo, if someone sends this article to Hudson, Maholm, Medlen, Minor, Beachy, and Teheran, we may see the team play the entire second half in their retro alt and normal cap.
EDIT: Braves pitcher Brandon Beachy tweeted us to correct the above statement. In truth, the Braves only wear the cream on weekends, and the pitcher has the luxury of choosing the team’s uniform for road games. So, now we know that the Braves won’t be wearing their retro uniforms in your town, unless it is Atlanta. And that the Braves are monsters on the weekend.
TORONTO BLUE JAYS ROAD GREYS

Winners of the off-season, or so it would have seemed, the Toronto Blue Jays are not where any reasonable person expected them to be heading into 2013. After adding multiple Cy Youngs, Batting Titles, Gold Gloves, and All-Stars the Jays sit in the cellar of the AL East with a record of 45-49. Could’ve accomplished the same feat without all the high priced talent or perhaps they’re just not wearing the right uniform…
At home the club is sitting around the .500 mark (14-12) when they wear a white jersey, and the same in their blues at 10-9. But when you look at road games, things get a little strange:
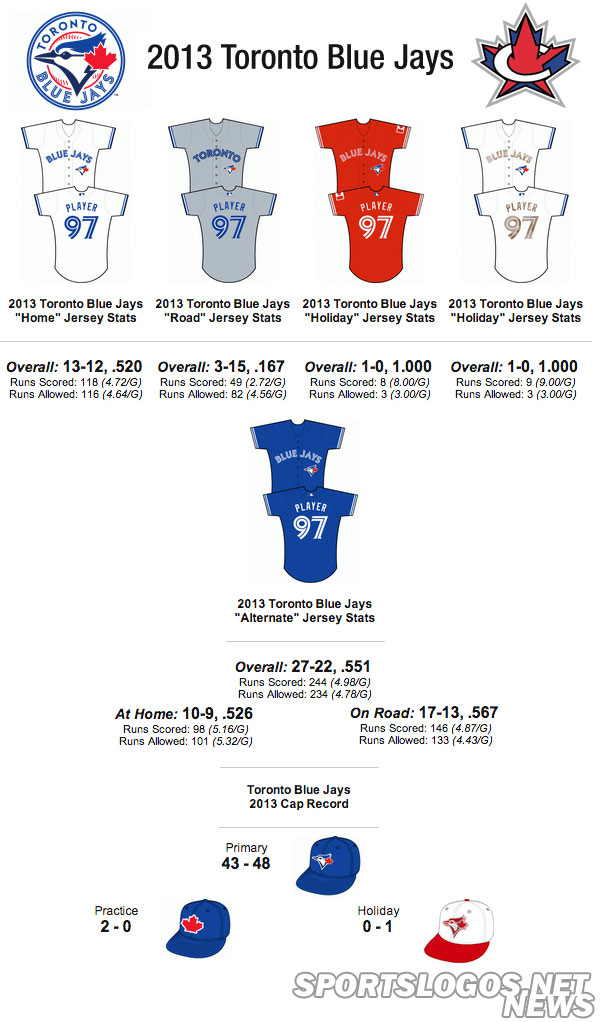
While the Jays are playing very respectable road ball in the blue alternates at 17-13 averaging 4.9 runs scored per game, it’s when they don the road greys in which things just turn to disaster. A record of 3-15, a winning percentage of .167, over 2 fewer runs scored per game (2.7 in grey, 4.9 in blue). What?! If you remove every game in which the team wore grey from their season record they’re 42-34 and on pace for a 90-win season. I hate to say it because I love the look of it, but burn the greys already!
MIAMI MARLINS “RED-ORANGE” ALTERNATES

The Miami Marlins are a bad team, let’s cut right to the chase, after finishing up 2012 at 69-93, they’re now once again dead last in the NL East so far in 2013 with a record of 35-58, 18 games back of the first place Braves.
When the Marlins take to their home field wearing the standard home whites they’re winning only 35% of the time with a record of 11-20. They average just under 3 runs a game and give up 4.2 – but when they switch to the alternate bright orange tops for those home games they suddenly become a winning ballclub… a much improved record of 7-3 and scoring nearly 2 extra runs per game (4.7 in orange, 2.9 in white), also allowing one fewer run. Perhaps visiting opponents just can’t handle 9 innings of seeing that orange jersey under the bright South Florida sun?
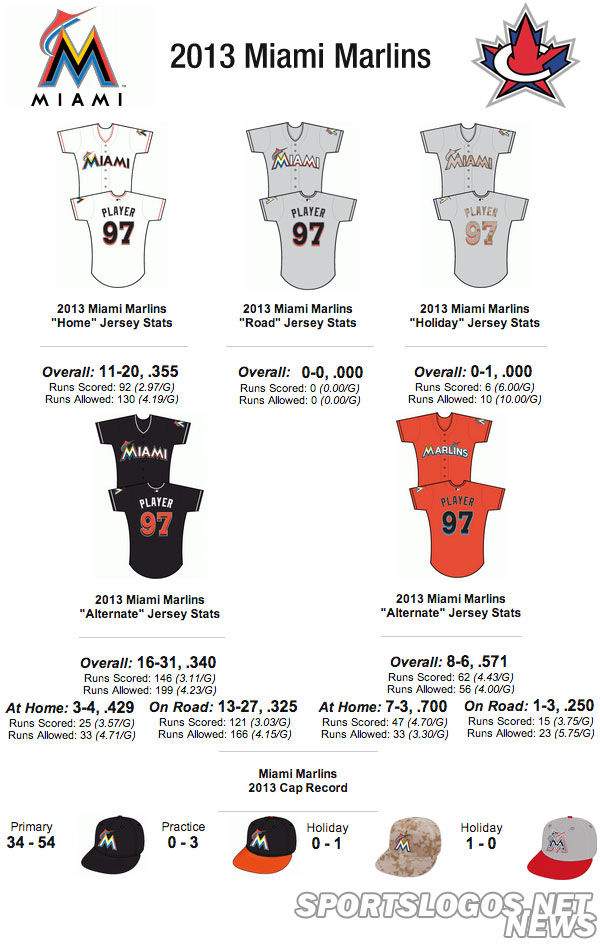
Also worthy of note, the Marlins have yet to wear their road grey jerseys during the 2013 season – the only team in the league to do so. They’ve instead chosen to wear their alternate black jersey for the majority of road contests (they’ve worn black in 40 of their 45 road games). The only time the club has worn a grey jersey at all this year was on Memorial Day when a camouflaged version of those lost road greys were worn in a 10-6 loss to Tampa Bay. Also missing this season, the all-orange alternate cap has yet to be worn. If they’re 7-3 at home with a black cap and orange jersey imagine how they’d be with an all-orange lid added on top! Unstoppable! Unwatchable!
CHICAGO WHITE SOX ROAD GREYS

It’s been a disappointing season overall for the Pale Hose, but nothing can explain the odd dip in team performance when they wear their road greys, and for the sake of those shouting “that’s cause they’re on the road, dummy!” at their screens, we’re comparing their road grey performance to their other road games in which they don’t wear the greys. Home games are not entering into the equation.
In 2013 the White Sox have worn a grey jersey on the road 25 times (24 in standard road grey, once in a grey camo version for the Angels’ Military Tribute Day), in those 25 games the White Sox are 6-19, averaging 5.2 runs allowed per contest. In the games in which they wear black on the road, they’re still sub-500 but still considerably better, 12-14 and only allowing 3.7 runs per game, that’s a run and a half fewer runs scored by their opponents just switching from grey to black.

Chicago also wore a white jersey on the road for a game in Tampa Bay taking part in their 1970’s faux throwback promotion, naturally as it was a non-black jersey on the road they lost the game 3-0.
WASHINGTON NATIONALS HOME CAPS

In the off-season the Washington Nationals, during their efforts to improve an already division-winning ballclub, unveiled a new cap. This cap was to be worn for home games, red on the top, blue on the bill – a reversal of their road cap and just slightly different from their existing home cap – the all red one the club had been wearing for a few years now for games in the capital.
Well, either that new red/blue cap is unlucky or the incumbent all-red cap is just pure success, pick whichever way you wanna go, when wearing the unlucky lid the Nats are 4-9, a .308 winning percentage, and these are all home games, allowing 4.8 runs per game. Now when going all-red at that very same ballpark the Nationals are an incredible 21-8, a .724 winning percentage, allowing only 3.07 runs per game, that’s a drop of almost 2 runs per game.

We’re not really sure what’s going on either, but when you combine their blue/red road cap and a throwback worn during the season the Nationals are a combined 26-38 in caps with a decent amount of blue, 22-8 in caps with mostly red and no blue. Perhaps it’s a hint at their political leanings? Who knows!
OTHER QUICK ODDITIES…
The New York Mets should switch to a rotation of their cream home jerseys at CitiField and their new blue road alternates for away games and just leave it that way. At home in cream the Mets are 11-9 (10-9 in homes, 1-0 in Memorial Day camo); at home in anything else (blue, white) they’re 6-18. On the road the Mets are 9-12 in their grey jerseys but a swell 15-10 in the new blues.
Milwaukee has worn 10 different jerseys during the 2013 season, we’re not sure but that’s probably a record-breaking pace, however if they want to play good baseball (and let’s face it, this has not been their year) they should stick with the standards when playing at Miller Park. For home games the Brewers are 12-7 when they wear white, 10-19 in anything other than white. They’re a combined 0-5 when wearing special one-off jerseys, and a combined 0-6 when wearing anything other than their primary or alternate cap. Keep it simple Milwaukee, it’s working better for the club when you do!
Leaving the high altitude of Coors Field can’t be easy for the Colorado Rockies, but I can’t understand how the jersey colour would have anything to do with it. For road games during the season the Rox are 14-16, scoring 4.1 runs/game in their usual greys, but when they switch to their purple alternates they lose 1.3 runs scored per game and drop to 5-12.
Tampa Bay has been wearing two jerseys regularly when playing away from the Trop, their road greys and an all navy-blue top complete with navy blue numbers and jersey lettering. Think of it as camo for deep-sea diving… or for opposing teams as the Rays are a respectable 15-12 wearing it on the road, allowing a full run fewer per game than when they wear those not-so-camouflagey road greys in which they are a not-at-all respectable 6-11.
JERSEY RANKINGS
So what jerseys are the best in the bigs? Well we’ve broken down that data into two categories, their records while worn at home and while on the road and presented the top 5 in each to you in the graphic below. The win-loss totals you see under each jersey are their record at home or on the road while wearing that top and are ranked 1-5 from left to right. Minimum 10 games required for a jersey to appear on this list:

And of course, the worst of the bunch… burn them all!

And that’s just what we found during a quick perusing of this data, every team is full of interesting little quirks when it comes to what they wear and how they play in it. I encourage you to browse through the teams below and see how your team does in each of their uniforms – if you find something odd then post it in the comments, we’d love to see anything we’ve missed!
MLB Jersey Stats Per Team
Click the logo to see their stats
 |  |  |  |  |
 |  |  |  |  |
 |  |  |  |  |
 |  |  |  |  |
 |  |  |  |  |
 |  |  |  |  |
If you found this info interesting then please check out our MLB Uniform Tracker, like I said earlier we’re going to keep this going throughout the rest of the 2013 season and if it proves to be popular then we’ll roll it out to other sports come the fall.
So, does the uniform a team wear effect (or affect?) their performance? Well, probably not, but given how superstitious a ballplayer can be maybe it’s a psychological thing or something. After seeing some of the stats presented above, what do you guys think?
Related stories:
 Texas Rangers To Unveil City Connect Uniforms On April 17
  Goin’ Green: A photo roundup of St Patricks Day 2013 Uniforms
  MLB13: The Show Uniforms Preview – AL East
  St Louis Cardinals Unveil New Alt Uniform, Red Caps on Road
  Turn Ahead the Clock Uniforms, MLB’s failed idea of the ’90s
  Atlanta Braves Unveil New Alternate Jersey
  2012 AL All-Star Game Jersey in MLB12 Trailer?
  Orioles go back to the 80’s with new caps, jersey
